Monitoring
Whether it’s a business website, an Intranet application, a set of micro-services or a large infrastructure set-up, it’s essential that those services stay up and running, available to your collaborators or customers. TenTwentyFour1024 offers monitoring services on both our own or your pre-existing infrastructure – to not only keep an eye on any critical services, but also intervene and solve or mitigate the problems as – or even before – they occur.
Examples of systems that we monitor range from simple checks on your website to make sure it’s available, responsive and the underlying framework or CMS is up to date, over detection of DDoS or brute-force attacks on your application’s authentication, all the way to watching multiple system and application vitals distributed across a larger server infrastructure.
TenTwentyFour1024 uses a three-fold monitoring set-up for Log-Management, Trending, and Alerting. Log-Management and Trending allow us to detect problems that lurk in the future, why Alerting will notify us immediately should part of a system spontaneously enter a critical state.
Let us advise you in which components of your system are most critical to assess, before you – as our customer – decide which and what number of metrics to check if, and how fast we should intervene, and whom we should notify in which delays if the state of one of your systems become problematic or even critical.
Dashing Dashboards
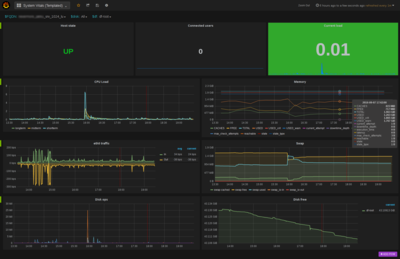
Humans are simply way better at grasping a situation when looking at graphs than at the raw numbers. At TenTwentyFour1024, we rely on Grafana to visualize performance data, thresholds, system vitals and even various events on a series of customizable dashboards.

The live-updating dashboard allow us to closely monitor current developments or go back several weeks into the past to get the big picture of how a system or service behaved in the past and compares to what is currently happening.
Are there events that consume unusually high amounts of memory? How does a sharp increases in traffic on your website impact memory usage? Will you have to add storage capacity and how fast does it dwindle? Did the database service problems only occur after the latest version of your application got deployed into production?
This is only a subset of the questions that we can answer from setting up trending and graphs from the data we collect from your systems.
In addition to the data we gather from checks through Icinga2 and pipe into a time-series database to be visualized in Grafana, we often choose to collect additional data from metric-collectors such as collectd.
Red Alert!

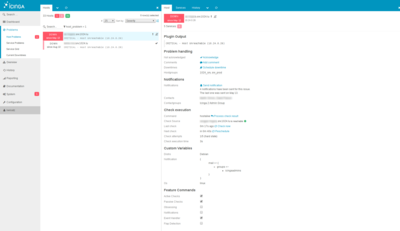
The TenTwentyFour1024 control post runs Icinga2 to make sure all monitored systems and services are nominal.
Several availability, health and performance checks are either defined manually or automatically defined and deployed through our configuration management utility and then run against the respective systems every few minutes. Such checks can be quite basic or more complex, if required. We always start by checking whether the systems are reachable over the network and might end up, for instance checking when the latest record was written to a specific table in a database.
With hundreds of checks already made available by the Free Software community, we’ve already got some ground covered, but for anything that needs checking and doesn’t yet have a ready-made plug-in or utility, we create custom check scripts to cover all the bases.
Custom-defined thresholds allow us to precisely specify when a service enters a problematic state and when this state becomes critical. As with trending, reacting quickly, as soon as services leave their nominal state, allows us to intervene pre-emptively and take counter-measures.
Whenever Icinga2 detects a service leaving its nominal state, TenTwentyFour1024 is notified through several independent communication channels, allowing us to react as soon as possible. You – as our customer – may wish to have notifications go to us first and only escalated to your own IT department after some hours, or the other way around, depending on your preferred SLA.
Keeping Book
Centralised log-management is another important pillar of watching over your infrastructure. Most services on your infrastructure already log detailed information about anything that happens and especially about out-of-the-ordinary incidents. Why ignore that data, when you have a treasure-trove right under your nose?

If you manage a single server instance, you could always log into your server and grep through your logfiles. However, imagine you have dozens, if not hundreds of servers, how should you keep an eye on all those logs? How to spot the one entry that gives away a security issue? How will you access and analyse your logs to determined what happened when your server becomes unreachable? Which logs will you analyse in the – worst case – scenario where your server has been compromised and the attacker has deleted all logs to covers their tracks?
This is where centralised log-management comes into play.
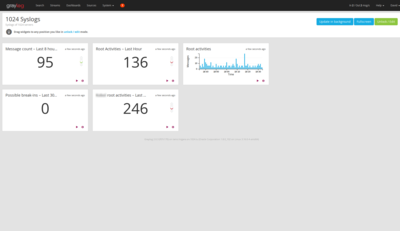
TenTwentyFour1024 uses Graylog2 to ship logs from all its servers and some critical services to a central Graylog/Elasticsearch cluster which aggregates and indexes the log entries. With all your log entries in one, easily searchable index, we can set up dashboards to detect trends and special events in log files effortlessly.
For instance, at TenTwentyFour1024, one dashboard displays the rate of emails rejected directly by our greylists, or determined to be SPAM/HAM, while also displaying recipient email addresses who receive most of the spam emails in a pie-chart graph.
Additionally, instead of alerting from system checks only, we can now leverage the data that gets naturally and periodically logged to detect anomalies and thus again create alerts that notify us whenever specific events are logged or services – that were expected to – fail to do so.
Contact us to discuss your monitoring need and together let us come up with a detailed monitoring plan and a Service Level Agreement (SLA) that fit your needs.